Wimbledon Property Prices Hold Their Own Despite Capital Decline
Latest sales figures show prices have risen by 7% in a year
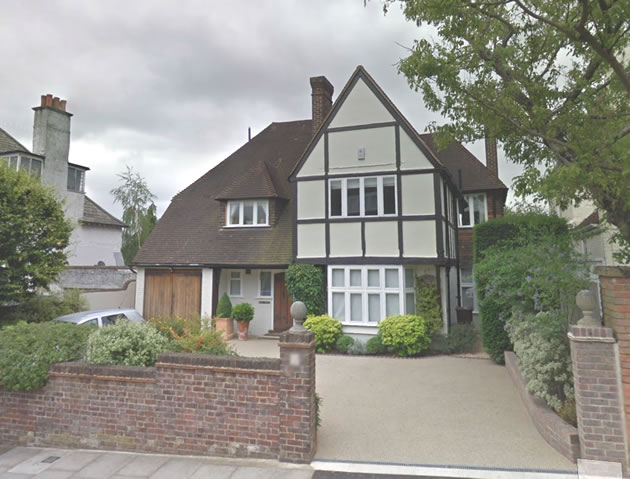
House in Marryat Road sold for over £4million
Property prices in Wimbledon are holding their own, despite fewer sales in the area, according to the latest Land Registry figures.
The average price for properties sold in Wimbledon in the last three months of 2017 was £848,810. While this was a drop from the £857,937 average SW19 price reported at the start of 2017, overall prices in Wimbledon have risen by 5.7% since the last quarter and 7% in a year.
In terms of property type the market for family properties appears to have remained robust with prices and transactions similar to the levels seen at the same time last year. However, the number of flat sales has fallen sharply with little demand apparent for new build developments.
Despite broader concerns about the economy and stamp duty changes, the very top end of the market remains active with 16 properties selling for over £2million in the SW19 post code are and 4 for over three. The highest priced property sold was a detached home on Marryat Road which went for over £4million.
Wimbledon has also bucked the trend seen across the rest of the capital. According to the Nationwide House Price Index, property values in London as a whole fell for the first time in eight years during 2017 - down by half a percent. This made it the weakest performing region of the country for the first time since 2004.

Across the UK the price of the average home rose by 2.6% to £211,156 with low mortgage rates and healthy employment growth supporting price. However, prices were held back by mounting pressure on household incomes and declining consumer confidence. Demand from buy to let investors was also held back by stamp duty and tax changes during the year.
The RICS, the professional body for surveyors, is predicting a further though slight reduction in sales this year and further price declines in the London area. They are not expecting these to be significant because of the lack of supply.
RICS UK Market Survey has recently shown buyer enquires stalling, sales volumes stagnating and sentiment turning altogether more cautious as a result in the final quarter of the year. They say stock on estate agents books close to all-time lows.
Tarrant Parsons, RICS Economist, commented, "Following a pretty lacklustre finish to 2017, the indications are that momentum across the housing market will be lacking as 2018 gets underway. With several of the forces currently weighing on activity set to persist over the near term, it's difficult to envisage a material step-up in impetus during the next twelve months. However, the fundamentals are not much changed from the end of 2017, so levels of activity should soften only marginally when compared to the year just ending. A real lack of stock coming onto the market remains one of the biggest challenges, while affordability constraints are increasingly curbing demand in some parts. Given these dynamics, price growth may fade to produce a virtually flat outturn for 2018.
"That said, despite the recent interest rate hike, mortgage rates are set to remain very favourable, with the prospect of further rises seemingly minimal over the coming year. Alongside this, government schemes such as help to buy should continue to provide some support to sales activity."
The numbers below are subject to revision as is it usual that some properties are added late to the Land Registry's database.
WimbledonSW19.com is the only place that you will find detailed analysis of the Wimbledon property market.
Wimbledon Property Prices (October - December 2017) |
||||||||||
|---|---|---|---|---|---|---|---|---|---|---|
| Area | Detached | Sales | Semi-det | Sales | Terrace | Sales | Flat/ mais |
Sales | Overall ave | Total sales |
SW19 1 |
0 |
0 |
955000 |
2 |
728768 |
11 |
446409 |
11 |
618206 |
24 |
SW19 2 |
0 |
0 |
775000 |
1 |
590667 |
9 |
373635 |
25 |
440911 |
35 |
SW19 3 |
2690000 |
1 |
1055588 |
17 |
992545 |
11 |
464611 |
9 |
940382 |
38 |
SW19 4 |
2483333 |
3 |
1975000 |
2 |
1536530 |
3 |
671541 |
11 |
1231397 |
19 |
SW19 5 |
2603125 |
8 |
3300000 |
1 |
981600 |
5 |
659230 |
3 |
1824158 |
17 |
SW19 6 |
2517050 |
1 |
0 |
0 |
480750 |
2 |
388156 |
16 |
509950 |
19 |
SW19 7 |
2900000 |
1 |
1425000 |
3 |
1177500 |
2 |
633993 |
7 |
1074458 |
13 |
SW19 8 |
0 |
0 |
1317500 |
4 |
874875 |
32 |
424275 |
20 |
745562 |
56 |
Total |
2598718 |
14 |
1247500 |
30 |
867741 |
75 |
460112 |
102 |
840810 |
221 |
Change in Quarter |
-6.0% |
7.7% |
-0.6% |
-9.1% |
3.2% |
-21.9% |
-4.5% |
-29.2% |
5.7% |
-22.7% |
Change in year |
-18.3% |
7.7% |
1.1% |
30.4% |
4.3% |
-3.8% |
3.6% |
-22.7% |
7.0% |
-10.2% |
Change in Three Years |
7.9% |
75.0% |
-31.0% |
57.9% |
5.7% |
-5.1% |
12.8% |
-42.4% |
24.8% |
-21.9% |
Change in Five Years |
21.9% |
-33.3% |
46.0% |
-23.1% |
56.1% |
-27.2% |
39.2% |
-38.6% |
45.5% |
-32.8% |
Change in Ten Years |
59.8% |
-30.0% |
81.1% |
-3.2% |
80.4% |
-35.3% |
49.3% |
-61.4% |
89.7% |
-48.7% |
Source: Land Registry
March 16, 2018