Home Buyers In Wimbledon Not Fazed By No Deal Brexit Threat
SW19 property market is still out-performing other parts of London
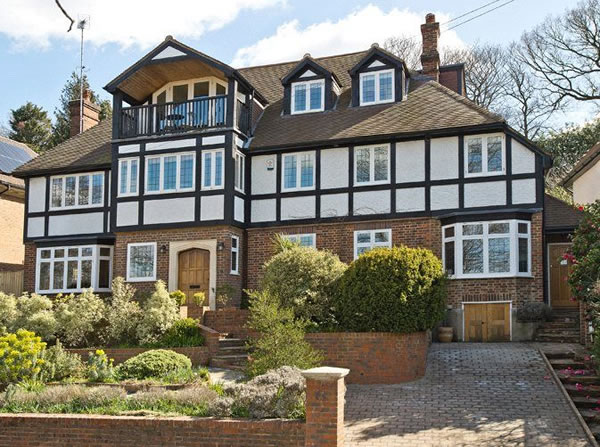
Pictured above is a property sold for £3.7m in Home Park Road, Wimbledon Village
Property prices in Wimbledon have again performed better than the rest of London with the latest sales data despite the economic uncertainty relating to Brexit. Prices in the SW19 postcode area averaged over £834,000 in the second quarter of 2019 up over the year whilst generally in London prices were down.
The figures from the Land Registry put prices at 8% above the level seen in the same period last year, although prices have again fallen in the latest three months and much of the rise can be attributed to the higher proportion of houses against flats being sold during the period.
The average price of all properties sold in SW19 fell by 4.8% between January-March 2019 and April-June 2019. This followed a 4.7% drop from the last quarter of 2018 to the first quarter of 2019.
However, the overall price level in SW19 has again been boosted with the sale of some high ticket detatched properties, including the £7.25m paid in May for a house in Peek Crescent, Wimbledon Village, while a house round the corner in Marryat Road fetched £6million in June.
The family home pictured above in Home Park Road, overlooking Wimbledon Park lake, sold for £3.7m in April.

According to the Nationwide House Price Index the average sale price in London was £465,722 down by 3.8% in the second quarter compared to the previous three months. Over the last year prices are down by 0.7% This is the eighth consecutive quarterly decline for London in a row. Moreover, prices in the capital are still only around 5% below the all-time highs recorded on Q1 2017 and c50% above their 2007 levels (by comparison, UK prices are only around 17% higher over the same period).
For the UK as a whole the average sale price was up by 0.4% over the last year to £215,910 with Northern Ireland seeing the strongest performance.
Commenting on the figures, Robert Gardner, Nationwide's Chief Economist, said: “Survey data suggests that new buyer enquiries and consumer confidence have remained subdued in recent months. Nevertheless, indicators of housing market activity, such as the number of mortgages approved for house purchase, have remained broadly stable.
“Housing market trends are likely to continue to mirror developments in the broader economy. While healthy labour market conditions and low borrowing costs will provide underlying support, uncertainty is likely to continue to act as a drag on sentiment and activity, with price growth and transaction levels remaining close to current levels over the coming months.”
The RICS UK Residential Market Survey for the second quarter concluded, “Although anecdotal commentary from respondents remains generally a little downbeat, contributors reported a rise in buyer demand, that new instructions have held steady, and that newly agreed sales also edged into positive territory for the first time in twenty-eight months.”
WimbledonSW19.com is the only place that you will find detailed analysis of the Wimbledon property market. Register to receive fortnightly updates including regular reports like this one.
Wimbledon Property Prices (April - June 2019) |
||||||||||
|---|---|---|---|---|---|---|---|---|---|---|
| Area | Detached | Sales | Semi-det | Sales | Terrace | Sales | Flat/ mais |
Sales | Overall ave | Total sales |
| SW19 1 | 1400000 | 2 | 782500 | 2 | 749792 | 12 | 402745 | 13 | 641317 | 29 |
| SW19 2 | 0 | 0 | 530000 | 1 | 481667 | 6 | 385627 | 11 | 425661 | 18 |
| SW19 3 | 1220000 | 1 | 951910 | 10 | 659625 | 8 | 300000 | 2 | 791243 | 21 |
| SW19 4 | 2200000 | 1 | 1725000 | 2 | 850000 | 1 | 628937 | 8 | 960958 | 12 |
| SW19 5 | 4605000 | 2 | 0 | 0 | 1185000 | 2 | 731750 | 4 | 1813375 | 8 |
| SW19 6 | 1700000 | 1 | 0 | 0 | 1065000 | 2 | 410250 | 12 | 583533 | 15 |
| SW19 7 | 3325000 | 2 | 1620000 | 2 | 667500 | 2 | 627625 | 8 | 1160429 | 14 |
| SW19 8 | 1400000 | 2 | 1273333 | 6 | 923128 | 18 | 408500 | 4 | 956344 | 30 |
| Total | 2416364 | 11 | 1128004 | 23 | 793447 | 51 | 477646 | 62 | 834041 | 147 |
| Change in Quarter | -11.4% | -42.1% | -3.8% | -17.9% | -0.2% | -12.1% | -1.3% | -37.4% | -4.8% | -27.9% |
| Change in year | -29.4% | 10.0% | -13.1% | 4.5% | -1.9% | -34.6% | 6.3% | -51.2% | 8.0% | -38.0% |
| Change in Three Years | 8.0% | 22.2% | -23.5% | 15.0% | -9.4% | -16.4% | 2.7% | -45.1% | 8.8% | -27.6% |
| Change in Five Years | -17.4% | -26.7% | -4.1% | -30.3% | 7.3% | -56.4% | 8.0% | -67.4% | 16.9% | -58.6% |
| Change in Ten Years | 24.7% | -31.3% | 39.2% | -32.4% | 56.2% | -28.2% | 67.3% | -72.8% | 82.2% | -57.9% |
Source: Land Registry
August 16, 2019