Wimbledon House Prices Stutter, But Still Out-Perform London Average
SW19 property market is still doing better than other parts of the capital
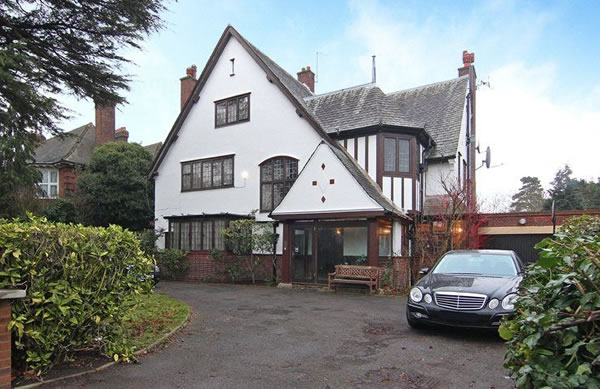
Pictured above is a property sold for £4.25m in Parkside, Wimbledon Village
Property prices in Wimbledon have continued to perform better than elsewhere in London, although they have fallen again in the latest quarter.
Prices in the SW19 postcode area averaged over £814,000 in the third quarter of 2019 - a 0.9% fall from the April to June 2019 figures when the average was over £834,000.
The figures from the Land Registry put prices in SW19 at 2.3% below the level seen in the same period last year.
But prices across London as a whole fell 1.4% during the quarter, and the SW19 sales volume was maintained - with 200 properties sold in the postcode area from July to September.
However, the overall price level in SW19 has again been boosted with the sale of some high ticket properties, including the £4.25m paid in August for the house pictured above in Parkside, Wimbledon Village, while a house in nearby Lauriston Road fetched £4.15m in July.
There were just two other homes sold for more than £2.5m during the quarter.

The Land Registry House Price Index for August 2019 shows that overall prices were down by 1.4% in London which made it the worse performing area in the UK. For the country as a whole the average price rose by 1.3% to £234,853.
The Royal Institution of Chartered Surveyors’ (RICS) August 2019 UK Residential Market Survey reported a flat trend in demand (new buyer enquiries) at the national level, following a few months in which enquiries had increased modestly. Newly agreed sales moved slightly further into negative territory. Alongside this, new instructions to sell were broadly unchanged for the third successive report.
The Bank of England’s Agents‘ summary of business conditions – 2019 Q3 reported that the housing market continued to soften, reflecting deteriorating supply and demand. Estate agents reported softer demand in the secondary market, though demand for lower-priced properties was more resilient.
The UK Property Transactions Statistics for August 2019 showed that on a seasonally adjusted basis, the estimated number of transactions on residential properties with a value of £40,000 or greater was 99,890. This is 0.9% higher than a year ago. Between July 2019 and August 2019, transactions increased by 15.8%.
The Bank of England’s Money and Credit release reported that mortgage approvals for house purchase (an indicator of future lending) decreased in August 2019 to 65,500. This is down from the previous peak seen in July 2019 of 67,000 but remained within the narrow range seen over the past 3 years.
WimbledonSW19.com is the only place that you will find detailed analysis of the Wimbledon property market. Register to receive fortnightly updates including regular reports like this one.
Wimbledon Property Prices (July - September 2019) |
||||||||||
|---|---|---|---|---|---|---|---|---|---|---|
| Area | Detached | Sales | Semi-det | Sales | Terrace | Sales | Flat/ mais |
Sales | Overall ave | Total sales |
SW19 1 |
2000000 |
1 |
726500 |
2 |
751133 |
18 |
455787 |
15 |
661394 |
36 |
SW19 2 |
0 |
0 |
830000 |
2 |
554214 |
7 |
376757 |
20 |
450850 |
29 |
SW19 3 |
2300000 |
1 |
998958 |
12 |
785000 |
9 |
485337 |
8 |
841173 |
30 |
SW19 4 |
1030000 |
1 |
3066667 |
3 |
0 |
0 |
722500 |
6 |
1456500 |
10 |
SW19 5 |
2010000 |
3 |
4250000 |
1 |
1462500 |
4 |
584083 |
6 |
1402464 |
14 |
SW19 6 |
0 |
0 |
1025000 |
1 |
801000 |
5 |
380267 |
15 |
511143 |
21 |
SW19 7 |
2310000 |
3 |
1776667 |
3 |
1287500 |
2 |
602917 |
6 |
1318036 |
14 |
SW19 8 |
0 |
0 |
1411540 |
4 |
855905 |
32 |
440400 |
10 |
813894 |
46 |
Total |
2032222 |
9 |
1448274 |
28 |
834855 |
77 |
463019 |
86 |
814726 |
200 |
Change in Quarter |
-18.9% |
-30.8% |
26.5% |
-6.7% |
1.6% |
13.2% |
-1.8% |
-4.4% |
-0.9% |
-0.5% |
Change in year |
-43.1% |
-30.8% |
12.1% |
-36.4% |
-1.6% |
-17.2% |
-3.3% |
-46.6% |
-2.3% |
-35.7% |
Change in Three Years |
-20.2% |
-40.0% |
3.3% |
47.4% |
0.1% |
0.0% |
-2.3% |
-38.6% |
4.6% |
-20.3% |
Change in Five Years |
-47.1% |
-52.6% |
18.7% |
-22.2% |
4.3% |
-35.3% |
8.1% |
-60.6% |
4.5% |
-49.0% |
Change in Ten Years |
23.9% |
-57.1% |
78.3% |
-51.7% |
76.8% |
-24.5% |
85.3% |
-49.4% |
66.1% |
-43.0% |
Source: Land Registry
November 22, 2019