Wimbledon House Prices Rally With Big Ticket Sales
Final quarter boost for SW19 helps property market remain stable
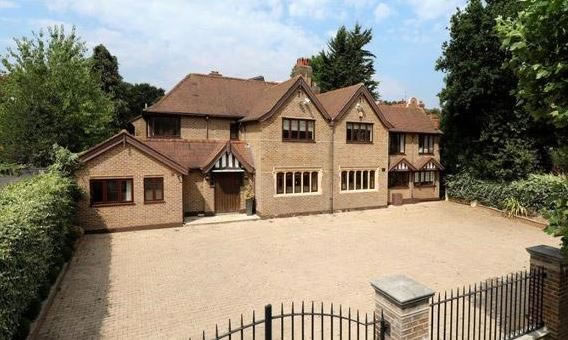
Pictured above is a property sold for £9m in Parkside, Wimbledon Village
Property prices in Wimbledon had a rally in the final quarter of 2019, although the value of homes sold across SW19 in the year has fallen by 3%.
Prices in the SW19 postcode area averaged over £871,000 in the final quarter of 2019 - a 6% increase from the July to September figures when the average was over £814,000.
But the figures from the Land Registry put prices in SW19 at 3% below the level seen in the same period last year. There were also fewer properties sold in the final quarter - 187, compared with 200 in July to September.
Prices across the UK as a whole grew during the year and are expected to pick up further in 2020.
The overall price level in SW19 was again boosted with the sale of some high ticket properties, including the £9m paid in October for the house pictured above in Parkside, Wimbledon Village, while a house in nearby Arthur Road fetched £7.7m in the same month.
Ten other homes sold for more than £2.5m during the quarter, while just four were in that price bracket in the previous quarter.

For the country as a whole prices grew by 1.4% in 2019 to reach an average of £215,282 according to the Nationwide House Price Index. The figures from National Statistics show a 2.2% rise to November 2019 to an average of £235,298.
Commenting on the figures, Robert Gardner, Nationwide's Chief Economist, said, “January saw a further modest pick-up in annual UK house price growth to 1.9%, from 1.4% in December. This follows twelve 12 successive months in which annual price growth had been below 1%.
“Indicators of UK economic activity were fairly volatile for much of 2019, but the underlying pace of growth slowed through the year as a result of weaker global growth and an intensification of Brexit uncertainty.
“Recent data continue to paint a mixed picture. Economic growth appeared to grind to a halt as 2019 drew to a close, though business surveys point to a pickup at the start of the New Year.“
The Royal Institution of Chartered Surveyors’ (RICS) November 2019 UK Residential Market Survey reported that key measures of buyer demand point to sales remaining in negative territory, the uncertainty surrounding the 2019 General Election and Brexit being the likely cause of suppressed activity. However, there is an expectation that a more stable trend is likely to emerge over the coming three months.
The Bank of England’s Agents’ summary of business conditions – 2019 Q4 reported that the housing market remained subdued, mainly due to the October Brexit deadline and the General Election. Contacts reported that house prices were modestly down on a year ago in the south and modestly up elsewhere.
Robert Gardner added: "Looking ahead, economic developments will remain the key driver of housing market trends and house prices. Much will continue to depend on how quickly uncertainty about the UK’s future trading relationships lifts, as well as the outlook for global growth.
"Overall, we expect the economy to continue to expand at a modest pace in 2020, with house prices remaining broadly flat over the next 12 months.".
WimbledonSW19.com is the only place that you will find detailed analysis of the Wimbledon property market. Register to receive fortnightly updates including regular reports like this one.
Wimbledon Property Prices (October - December 2019) |
||||||||||
|---|---|---|---|---|---|---|---|---|---|---|
| Area | Detached | Sales | Semi-det | Sales | Terrace | Sales | Flat/ mais |
Sales | Overall ave | Total sales |
| SW19 1 | 0 | 0 | 821250 | 2 | 727114 | 11 | 422344 | 16 | 565457 | 29 |
| SW19 2 | 689156 | 1 | 791083 | 6 | 555954 | 13 | 447886 | 11 | 567413 | 31 |
| SW19 3 | 0 | 0 | 1223571 | 7 | 820864 | 11 | 314431 | 8 | 773460 | 26 |
| SW19 4 | 3287500 | 2 | 2290833 | 3 | 1089167 | 3 | 570357 | 7 | 1380500 | 15 |
| SW19 5 | 9000000 | 1 | 0 | 0 | 1420000 | 1 | 565000 | 4 | 2113333 | 6 |
| SW19 6 | 880000 | 1 | 532500 | 1 | 620833 | 3 | 412965 | 17 | 467973 | 22 |
| SW19 7 | 3157500 | 5 | 1946250 | 4 | 1450000 | 1 | 527625 | 4 | 1938071 | 14 |
| SW19 8 | 1990000 | 1 | 1310786 | 7 | 894065 | 25 | 408500 | 11 | 863878 | 44 |
| Total | 3174696 | 11 | 1310650 | 30 | 803041 | 68 | 436879 | 78 | 871254 | 187 |
Change in Quarter |
12.7% | -8.3% | -1.9% | 0.0% | -4.0% | -24.4% | -7.6% | -33.3% | 6.1% | -24.9% |
Change in year |
-13.3% | -38.9% | 2.4% | 25.0% | -13.8% | -10.5% | -8.4% | -46.6% | -3.0% | -29.2% |
Change in Three Years |
-0.2% | -15.4% | 6.3% | 30.4% | -3.5% | -12.8% | -1.6% | -40.9% | 10.9% | -24.0% |
Change in Five Years |
31.8% | 37.5% | -27.5% | 57.9% | -2.2% | -13.9% | 7.1% | -55.9% | 29.3% | -33.9% |
Change in Ten Years |
75.8% | -42.1% | 74.3% | -16.7% | 75.9% | -43.8% | 49.6% | -65.8% | 92.1% | -53.7% |
Source: Land Registry
February 14, 2020